
Your first graph neural network: Detecting suspicious logins with link prediction#
Graphistry - Leo Meyerovich, Alex Morrise, Tanmoy Sarkar
Infosec Jupyterthon 2022, December 2022
Alert on & visualize anomalous identity events * Demo dataset: 1.6B windows events over 58 days => logins by 12K user over 14K systems * adapt to any identity system with logins * => Can we identify accounts & computers acting anomalously? Resources being oddly accessed? * => Can we spot the red team? * => Operations: Identity incident alerting + identity data investigations * Community/contact for help handling bigger-than-memory & additional features * Techniques explored: Graph AI - * RGCN (primary) - powerful with tweaking and in a pipeline * UMAP (secondary) - surprisingly effective with little tweaking * Runs on both CPU + multi-GPU * Tools: PyGraphistry[AI], DGL + PyTorch, and NVIDIA RAPIDS / umap-learn
Dependencies#
Installs#
installs below
… or docker (free): https://hub.docker.com/r/graphistry/graphistry-nvidia
…. or aws/azure/enterprise (paid) https://www.graphistry.com/get-started
[4]:
#! pip install --user --no-input "torch==1.11.0" -f https://download.pytorch.org/whl/cu113/torch_stable.html
[2]:
# ! python -c "import torch; print(torch.cuda.is_available())"
True
[3]:
#! pip install --user dgl-cu113 dglgo -f https://data.dgl.ai/wheels/repo.html
[4]:
#! pip cache remove graphistry
#! pip install --no-cache --user https://github.com/graphistry/pygraphistry/archive/heteroembed.zip

#! pip install --user git+https://github.com/graphistry/pygraphistry.git@fe894b556d078a35d1109c5cb78150818950d66d
#! pip install --user git+https://github.com/graphistry/pygraphistry.git@d7e87c0faf762be5c8779c71caf8da13fae48041
#! pip install --user git+https://github.com/graphistry/pygraphistry.git@6f47e034dcf8e96f241be66aca6a6a6374e7bf83
Imports#
[5]:
import pandas as pd
import os
from joblib import load, dump
from collections import Counter
import torch
print('torch', torch.__version__)

import numpy as np
import random
RANDOM_SEED = 42
np.random.seed(RANDOM_SEED)
torch.manual_seed(RANDOM_SEED)
random.seed(RANDOM_SEED)

import graphistry
print('graphistry', graphistry.__version__)
torch 1.11.0+cu113
graphistry 0.28.4+78.g6f47e03
graphistry#
[6]:
#graphistry.register(
# api=3,
#  protocol="https", server="hub.graphistry.com", client_protocol_hostname='https://hub.graphistry.com',
#  username = '***', password='***'
#)
Data#
Winlogs demo
Tested on 40M row sample (2 x RTX), 4M sample (3080 TI), and on a 32 GB CPU box
auth: auth.txt.gz (extractable from winlogs)optional: red team data (749 events flagged from auth.txt.gz)
Custom
Use any auth data like winlogs
load as dataframe
authkey fields:
auth_type(arbitrary values),src_computer(arbitrary values),dst_computer(arbitrary values)other fields nice but not necessary
some evaluation steps benefit from a red team but not necessary
Load identity events + optional red team data#
[7]:
%%time
# total size -> 1051430459/1.05B
auth = pd.read_parquet('data/auth40m.parquet')
print(auth.shape)
auth.head(5)
(40000000, 9)
CPU times: user 11.7 s, sys: 1.88 s, total: 13.6 s
Wall time: 6.14 s
[7]:
| time | src_domain | dst_domain | src_computer | dst_computer | auth_type | logontype | authentication_orientation | success_or_failure | |
|---|---|---|---|---|---|---|---|---|---|
| 0 | 1 | ANONYMOUS LOGON@C586 | ANONYMOUS LOGON@C586 | C1250 | C586 | NTLM | Network | LogOn | Success |
| 1 | 1 | ANONYMOUS LOGON@C586 | ANONYMOUS LOGON@C586 | C586 | C586 | ? | Network | LogOff | Success |
| 2 | 1 | C101$@DOM1 | C101$@DOM1 | C988 | C988 | ? | Network | LogOff | Success |
| 3 | 1 | C1020$@DOM1 | SYSTEM@C1020 | C1020 | C1020 | Negotiate | Service | LogOn | Success |
| 4 | 1 | C1021$@DOM1 | C1021$@DOM1 | C1021 | C625 | Kerberos | Network | LogOn | Success |
Red team comparison data (optional)#
[8]:
if True:
    red_team = pd.read_csv('data/redteam.txt', header=None)
else:
    # or whatever comparison set
    # unsupervised method so just for reporting
    red_team = auth.head(749)

print(red_team.shape)
red_team.head(5)
(749, 4)
[8]:
| 0 | 1 | 2 | 3 | |
|---|---|---|---|---|
| 0 | 150885 | U620@DOM1 | C17693 | C1003 |
| 1 | 151036 | U748@DOM1 | C17693 | C305 |
| 2 | 151648 | U748@DOM1 | C17693 | C728 |
| 3 | 151993 | U6115@DOM1 | C17693 | C1173 |
| 4 | 153792 | U636@DOM1 | C17693 | C294 |
[9]:
cols = auth.columns
anom_label = auth[
    auth[cols[0]].isin(red_team[0]) &
    auth[cols[1]].isin(red_team[1]) &
    auth[cols[2]].isin(red_team[1]) &
    auth[cols[3]].isin(red_team[2]) &
    auth[cols[4]].isin(red_team[3])
].reset_index()
anom_label
[9]:
| index | time | src_domain | dst_domain | src_computer | dst_computer | auth_type | logontype | authentication_orientation | success_or_failure | |
|---|---|---|---|---|---|---|---|---|---|---|
| 0 | 29627157 | 150885 | U620@DOM1 | U620@DOM1 | C17693 | C1003 | NTLM | Network | LogOn | Success |
| 1 | 29657341 | 151036 | U748@DOM1 | U748@DOM1 | C17693 | C305 | NTLM | Network | LogOn | Success |
| 2 | 29776464 | 151648 | U748@DOM1 | U748@DOM1 | C17693 | C728 | NTLM | Network | LogOn | Success |
| 3 | 29850298 | 151993 | U6115@DOM1 | U6115@DOM1 | C17693 | C1173 | NTLM | Network | LogOn | Success |
| 4 | 30188660 | 153792 | U636@DOM1 | U636@DOM1 | C17693 | C294 | NTLM | Network | LogOn | Success |
| 5 | 30425163 | 155219 | U748@DOM1 | U748@DOM1 | C17693 | C5693 | NTLM | Network | LogOn | Success |
| 6 | 30458238 | 155399 | U748@DOM1 | U748@DOM1 | C17693 | C152 | NTLM | Network | LogOn | Success |
| 7 | 30468055 | 155460 | U748@DOM1 | U748@DOM1 | C17693 | C2341 | NTLM | Network | LogOn | Success |
| 8 | 30489739 | 155591 | U748@DOM1 | U748@DOM1 | C17693 | C332 | NTLM | Network | LogOn | Success |
| 9 | 30662347 | 156658 | U748@DOM1 | U748@DOM1 | C17693 | C4280 | NTLM | Network | LogOn | Success |
| 10 | 39964825 | 210086 | U748@DOM1 | U748@DOM1 | C18025 | C1493 | NTLM | Network | LogOn | Success |
[10]:
anom_label['RED'] = 1

# enrich the edges with the red team data
ind = auth.index.isin(anom_label['index'])
auth.loc[ind, 'RED'] = 1
auth.loc[~ind, 'RED'] = 0

print('# red', auth['RED'].sum())

# let's see the bad infiltration point
auth[auth.src_computer == 'C17693'].sample(10)
# red 11.0
[10]:
| time | src_domain | dst_domain | src_computer | dst_computer | auth_type | logontype | authentication_orientation | success_or_failure | RED | |
|---|---|---|---|---|---|---|---|---|---|---|
| 39201345 | 206645 | U8350@DOM1 | U8350@DOM1 | C17693 | C467 | NTLM | Network | LogOn | Success | 0.0 |
| 29776464 | 151648 | U748@DOM1 | U748@DOM1 | C17693 | C728 | NTLM | Network | LogOn | Success | 1.0 |
| 38906146 | 205356 | U748@DOM1 | U748@DOM1 | C17693 | C3007 | NTLM | Network | LogOn | Success | 0.0 |
| 30188660 | 153792 | U636@DOM1 | U636@DOM1 | C17693 | C294 | NTLM | Network | LogOn | Success | 1.0 |
| 28845530 | 147076 | U8009@C926 | U8009@C926 | C17693 | C926 | NTLM | Network | LogOn | Fail | 0.0 |
| 28860620 | 147141 | U8009@C1759 | U8009@C1759 | C17693 | C1759 | NTLM | Network | LogOn | Fail | 0.0 |
| 39208487 | 206678 | U8350@DOM1 | U8350@DOM1 | C17693 | C529 | NTLM | Network | LogOn | Success | 0.0 |
| 39126261 | 206295 | U8350@DOM1 | U8350@DOM1 | C17693 | C529 | NTLM | Network | LogOn | Success | 0.0 |
| 29620541 | 150847 | U620@DOM1 | U620@DOM1 | C17693 | C1759 | NTLM | Network | LogOn | Success | 0.0 |
| 28359627 | 145015 | U1723@C1759 | U1723@C1759 | C17693 | C1759 | NTLM | Network | LogOn | Fail | 0.0 |
Quick viz#
[11]:
graphistry.edges(
    pd.concat([anom_label, auth.sample(100000)], ignore_index=True, sort=False),
    'src_computer', 'dst_computer'
).plot()
[11]:
Down-sample (optional)#
[12]:
if True:
    SAMPLE_PERCENT = 0.10
    print(f'sampling down {SAMPLE_PERCENT * 100}%')
    all_auth = auth
    all_auth_unred = all_auth[ all_auth.RED == 0 ]
    all_auth_red = all_auth[ all_auth.RED == 1 ]
    auth = pd.concat(
        [
            all_auth_unred.sample(frac=SAMPLE_PERCENT, random_state=RANDOM_SEED),
            all_auth_red
        ],
        ignore_index=True,
        sort=False)
    print(auth.shape)
sampling down 10.0%
(4000010, 10)
[13]:
# see the data and if everything was flagged (since this is timelike..)
auth[
    auth['src_computer'].isin(set(red_team[2])) &
    auth['dst_computer'].isin(set(red_team[3]))
].reset_index()
[13]:
| index | time | src_domain | dst_domain | src_computer | dst_computer | auth_type | logontype | authentication_orientation | success_or_failure | RED | |
|---|---|---|---|---|---|---|---|---|---|---|---|
| 0 | 1467943 | 206678 | U8350@DOM1 | U8350@DOM1 | C17693 | C529 | NTLM | Network | LogOn | Success | 0.0 |
| 1 | 3999999 | 150885 | U620@DOM1 | U620@DOM1 | C17693 | C1003 | NTLM | Network | LogOn | Success | 1.0 |
| 2 | 4000000 | 151036 | U748@DOM1 | U748@DOM1 | C17693 | C305 | NTLM | Network | LogOn | Success | 1.0 |
| 3 | 4000001 | 151648 | U748@DOM1 | U748@DOM1 | C17693 | C728 | NTLM | Network | LogOn | Success | 1.0 |
| 4 | 4000002 | 151993 | U6115@DOM1 | U6115@DOM1 | C17693 | C1173 | NTLM | Network | LogOn | Success | 1.0 |
| 5 | 4000003 | 153792 | U636@DOM1 | U636@DOM1 | C17693 | C294 | NTLM | Network | LogOn | Success | 1.0 |
| 6 | 4000004 | 155219 | U748@DOM1 | U748@DOM1 | C17693 | C5693 | NTLM | Network | LogOn | Success | 1.0 |
| 7 | 4000005 | 155399 | U748@DOM1 | U748@DOM1 | C17693 | C152 | NTLM | Network | LogOn | Success | 1.0 |
| 8 | 4000006 | 155460 | U748@DOM1 | U748@DOM1 | C17693 | C2341 | NTLM | Network | LogOn | Success | 1.0 |
| 9 | 4000007 | 155591 | U748@DOM1 | U748@DOM1 | C17693 | C332 | NTLM | Network | LogOn | Success | 1.0 |
| 10 | 4000008 | 156658 | U748@DOM1 | U748@DOM1 | C17693 | C4280 | NTLM | Network | LogOn | Success | 1.0 |
| 11 | 4000009 | 210086 | U748@DOM1 | U748@DOM1 | C18025 | C1493 | NTLM | Network | LogOn | Success | 1.0 |
Configure#
Identify src vs dst columns#
The RGCN connects homogeneous nodes (ex: computers) through heterogeneous relationships (ex: event types)
[14]:
SRC = 'src_computer'
DST = 'dst_computer'
#SRC = 'src_domain'
#DST = 'dst_domain'

NODE = 'computer'


##DST_OPP = 'dst_domain'
#SRC_OPP = 'src_computer'
#DST_OPP = 'dst_computer'
Feature engineering#
Node features - optional enrichment & event summaries#
Provided: If node features are available, handle here
Aggregated: We gather some here from the incoming vs outgoing edges
Graph analytics: Often useful to also add graph statistics here too (pagerank, centrality, …)
For bigger-than-memory, use dask (cpu) or dask_cudf (gpu)
[15]:
mode = pd.Series.mode
outgoing_conn_stats = auth[:1000].groupby([SRC]).agg({
    'time': ['min', 'max', 'mean'],
    'dst_domain': [mode, 'count'],
    'dst_computer': [mode, 'count'],
    'auth_type': [mode, 'count'],
    'logontype': [mode, 'count'],
    'authentication_orientation': [mode, 'count'],
    'success_or_failure': [mode, 'count']
})
outgoing_conn_stats.columns = [f'out_{c[0]}_{c[1]}' for c in outgoing_conn_stats.columns]

mode = pd.Series.mode
incoming_conn_stats = auth[:1000].groupby([DST]).agg({
    'time': ['min', 'max', 'mean'],
    'src_domain': [mode, 'count'],
    'src_computer': [mode, 'count'],
    'auth_type': [mode, 'count'],
    'logontype': [mode, 'count'],
    'authentication_orientation': [mode, 'count'],
    'success_or_failure': [mode, 'count']
})
incoming_conn_stats.columns = [f'in_{c[0]}_{c[1]}' for c in incoming_conn_stats.columns]


# outgoing_conn_stats
# incoming_conn_stats

nodes = pd.DataFrame({NODE: pd.concat([auth[SRC], auth[DST]]).unique()})
nodes = nodes.merge(outgoing_conn_stats, how='left', left_on=NODE, right_on=SRC)
nodes = nodes.merge(incoming_conn_stats, how='left', left_on=NODE, right_on=DST)
for c in ['min', 'max', 'mean']:
    nodes[f'out_time_{c}'] = nodes[f'out_time_{c}'].fillna(0.)
    nodes[f'in_time_{c}'] = nodes[f'in_time_{c}'].fillna(0.)


def flatten_lst(o):
    if isinstance(o, list):
        return o[0]
    if isinstance(o, str):
        return o
    return ''


for c in ['mode']:
    for k in ['dst_domain', 'dst_computer', 'auth_type', 'logontype', 'authentication_orientation', 'success_or_failure']:
        nodes[f'out_{k}_{c}'] = nodes[f'out_{k}_{c}'].apply(flatten_lst)
    for k in ['src_domain', 'src_computer', 'auth_type', 'logontype', 'authentication_orientation', 'success_or_failure']:
        nodes[f'in_{k}_{c}'] = nodes[f'in_{k}_{c}'].apply(flatten_lst)

for c in ['count']:
    for k in ['dst_domain', 'dst_computer', 'auth_type', 'logontype', 'authentication_orientation', 'success_or_failure']:
        nodes[f'out_{k}_{c}'] = nodes[f'out_{k}_{c}'].fillna(0)
    for k in ['src_domain', 'src_computer', 'auth_type', 'logontype', 'authentication_orientation', 'success_or_failure']:
        nodes[f'in_{k}_{c}'] = nodes[f'in_{k}_{c}'].fillna(0)

print(nodes.shape)
nodes.sample(10)
(10887, 31)
[15]:
| computer | out_time_min | out_time_max | out_time_mean | out_dst_domain_mode | out_dst_domain_count | out_dst_computer_mode | out_dst_computer_count | out_auth_type_mode | out_auth_type_count | ... | in_src_computer_mode | in_src_computer_count | in_auth_type_mode | in_auth_type_count | in_logontype_mode | in_logontype_count | in_authentication_orientation_mode | in_authentication_orientation_count | in_success_or_failure_mode | in_success_or_failure_count | |
|---|---|---|---|---|---|---|---|---|---|---|---|---|---|---|---|---|---|---|---|---|---|
| 1157 | C7249 | 0.0 | 0.0 | 0.0 | 0.0 | 0.0 | 0.0 | ... | 0.0 | 0.0 | 0.0 | 0.0 | 0.0 | ||||||||
| 10714 | C10703 | 0.0 | 0.0 | 0.0 | 0.0 | 0.0 | 0.0 | ... | 0.0 | 0.0 | 0.0 | 0.0 | 0.0 | ||||||||
| 3872 | C6943 | 0.0 | 0.0 | 0.0 | 0.0 | 0.0 | 0.0 | ... | 0.0 | 0.0 | 0.0 | 0.0 | 0.0 | ||||||||
| 8832 | C7472 | 0.0 | 0.0 | 0.0 | 0.0 | 0.0 | 0.0 | ... | 0.0 | 0.0 | 0.0 | 0.0 | 0.0 | ||||||||
| 10732 | C9999 | 0.0 | 0.0 | 0.0 | 0.0 | 0.0 | 0.0 | ... | 0.0 | 0.0 | 0.0 | 0.0 | 0.0 | ||||||||
| 2885 | C1555 | 0.0 | 0.0 | 0.0 | 0.0 | 0.0 | 0.0 | ... | 0.0 | 0.0 | 0.0 | 0.0 | 0.0 | ||||||||
| 1701 | C5796 | 0.0 | 0.0 | 0.0 | 0.0 | 0.0 | 0.0 | ... | 0.0 | 0.0 | 0.0 | 0.0 | 0.0 | ||||||||
| 7597 | C11731 | 0.0 | 0.0 | 0.0 | 0.0 | 0.0 | 0.0 | ... | 0.0 | 0.0 | 0.0 | 0.0 | 0.0 | ||||||||
| 5051 | C7485 | 0.0 | 0.0 | 0.0 | 0.0 | 0.0 | 0.0 | ... | 0.0 | 0.0 | 0.0 | 0.0 | 0.0 | ||||||||
| 8477 | C1548 | 0.0 | 0.0 | 0.0 | 0.0 | 0.0 | 0.0 | ... | 0.0 | 0.0 | 0.0 | 0.0 | 0.0 |
10 rows × 31 columns
Node features - auto-generation & compression#
[16]:
gg = graphistry.nodes(nodes, NODE)
g_sample = gg.featurize(
    cardinality_threshold=len(auth)+1,  # avoid topic modeling on high-cardinality cols
    min_words=len(auth)+1,  # avoid topic modeling on high-cardinality cols
)

X = g_sample._node_features
#print('memory', X.memory_usage())
print('sample low cardinality')
{
    c: X[c].nunique()
    for c in X.columns[:10] #sampled, good to manually inspect for nice columns
    if X[c].nunique() < 10
}
sample low cardinality
[16]:
{'out_dst_domain_mode_': 2,
 'out_dst_domain_mode_ANONYMOUS LOGON@C1065': 2,
 'out_dst_domain_mode_ANONYMOUS LOGON@C1628': 2,
 'out_dst_domain_mode_ANONYMOUS LOGON@C17899': 2,
 'out_dst_domain_mode_ANONYMOUS LOGON@C457': 2,
 'out_dst_domain_mode_ANONYMOUS LOGON@C467': 2,
 'out_dst_domain_mode_ANONYMOUS LOGON@C528': 2,
 'out_dst_domain_mode_ANONYMOUS LOGON@C529': 2,
 'out_dst_domain_mode_ANONYMOUS LOGON@C586': 2,
 'out_dst_domain_mode_ANONYMOUS LOGON@C625': 2}
[17]:
sums = X.sum(0)
good_feats = [c for c in X.columns if sums[c] > 10 or 'type' in c]

print('#total feats', len(X.columns))
print('#good feats (decent cardinality)', len(good_feats))
print(X[good_feats].sum(0).astype(int))
X[good_feats].sample(5)
#total feats 889
#good feats (decent cardinality) 74
out_dst_domain_mode_                        10411
out_dst_domain_mode_ANONYMOUS LOGON@C586       16
out_dst_computer_mode_                      10408
out_dst_computer_mode_C1065                    25
out_dst_computer_mode_C2106                    16
                                            ...
in_src_computer_count                        1000
in_auth_type_count                           1000
in_logontype_count                           1000
in_authentication_orientation_count          1000
in_success_or_failure_count                  1000
Length: 74, dtype: int64
[17]:
| out_dst_domain_mode_ | out_dst_domain_mode_ANONYMOUS LOGON@C586 | out_dst_computer_mode_ | out_dst_computer_mode_C1065 | out_dst_computer_mode_C2106 | out_dst_computer_mode_C457 | out_dst_computer_mode_C467 | out_dst_computer_mode_C528 | out_dst_computer_mode_C529 | out_dst_computer_mode_C586 | ... | out_success_or_failure_count | in_time_min | in_time_max | in_time_mean | in_src_domain_count | in_src_computer_count | in_auth_type_count | in_logontype_count | in_authentication_orientation_count | in_success_or_failure_count | |
|---|---|---|---|---|---|---|---|---|---|---|---|---|---|---|---|---|---|---|---|---|---|
| 3579 | 1.0 | 0.0 | 1.0 | 0.0 | 0.0 | 0.0 | 0.0 | 0.0 | 0.0 | 0.0 | ... | 0.0 | 0.0 | 0.0 | 0.0 | 0.0 | 0.0 | 0.0 | 0.0 | 0.0 | 0.0 |
| 6966 | 1.0 | 0.0 | 1.0 | 0.0 | 0.0 | 0.0 | 0.0 | 0.0 | 0.0 | 0.0 | ... | 0.0 | 0.0 | 0.0 | 0.0 | 0.0 | 0.0 | 0.0 | 0.0 | 0.0 | 0.0 |
| 4599 | 1.0 | 0.0 | 1.0 | 0.0 | 0.0 | 0.0 | 0.0 | 0.0 | 0.0 | 0.0 | ... | 0.0 | 0.0 | 0.0 | 0.0 | 0.0 | 0.0 | 0.0 | 0.0 | 0.0 | 0.0 |
| 409 | 0.0 | 0.0 | 0.0 | 0.0 | 0.0 | 0.0 | 0.0 | 0.0 | 0.0 | 0.0 | ... | 1.0 | 199787.0 | 199787.0 | 199787.0 | 1.0 | 1.0 | 1.0 | 1.0 | 1.0 | 1.0 |
| 5072 | 1.0 | 0.0 | 1.0 | 0.0 | 0.0 | 0.0 | 0.0 | 0.0 | 0.0 | 0.0 | ... | 0.0 | 0.0 | 0.0 | 0.0 | 0.0 | 0.0 | 0.0 | 0.0 | 0.0 | 0.0 |
5 rows × 74 columns
Edge features - Multi-column relationship types (optional)#
Untyped#
Useful for emulating a vanilla GCN via RGCN
[18]:
df = auth
df2a = df.assign(constant_edge_label=1)
Combos: reln as combined (auth_type x logontype)#
[19]:
df2 = df2a.assign(reln=df.auth_type + '::' + df.logontype)
df2.reln.sample(5)
[19]:
243922     Kerberos::Network
835852     Kerberos::Network
865963                  ?::?
3562087           ?::Network
1788835    Kerberos::Network
Name: reln, dtype: object
Compression: reln as topic model over many columns or high-cardinality columns#
To prevent too many relationship types blowing out memory, we can use tricks like topic models to cut down to a more reasonable set
[20]:
g_runiq = graphistry.nodes(df2.drop_duplicates(subset=['reln']))
g_featurized = g_runiq.featurize(X=['reln'], min_words=1000000, n_topics=15, cardinality_threshold=2)
X = g_featurized._node_features
X.sample(5)
[20]:
| reln: ntlm, wave, batch | reln: batch, ntlm, wave | reln: negotiate, ntlm, wave | reln: ntlm, wave, interactive | reln: microsoft_authentication_packa, microsoft_authentication_pack, microsoft_authentication_pac | reln: remoteinteractive, interactive, ntlm | reln: microsoft_authentication_package_v1, microsoft_authentication_package_v, microsoft_authentication_package_ | reln: kerberos, network, ntlm | reln: newcredentials, ntlm, wave | reln: microsoft_authentication_package_v1_0, microsoft_authentication_package_v1_, microsoft_authentication_package_v1 | reln: networkcleartext, ntlm, wave | reln: service, ntlm, wave | reln: unlock, wave, ntlm | reln: cachedinteractive, interactive, ntlm | reln: microsoft_authentica, microsoft_authentication_pa, microsoft_authentication_pac | |
|---|---|---|---|---|---|---|---|---|---|---|---|---|---|---|---|
| 339375 | 0.148557 | 0.056838 | 0.057913 | 0.152160 | 0.185454 | 0.174556 | 0.280331 | 0.054524 | 0.060744 | 70.747278 | 0.053815 | 0.058804 | 0.056780 | 0.522876 | 0.139371 |
| 7814 | 0.052674 | 0.055471 | 11.718799 | 1.717323 | 0.053624 | 25.518031 | 0.052828 | 0.054558 | 0.062141 | 0.060254 | 0.071018 | 0.085292 | 0.057539 | 0.137766 | 0.052682 |
| 683631 | 0.050558 | 0.053184 | 0.058496 | 0.053717 | 0.050803 | 0.051884 | 0.050711 | 0.051522 | 0.050903 | 0.050871 | 0.051656 | 0.052714 | 15.020143 | 0.052309 | 0.050528 |
| 237141 | 0.206005 | 0.056884 | 0.057404 | 0.057193 | 8.189937 | 0.054009 | 51.363086 | 0.262343 | 0.072549 | 0.211270 | 0.085901 | 0.055594 | 0.054310 | 0.057548 | 1.465967 |
| 4217 | 0.054613 | 0.074897 | 0.057616 | 0.056144 | 0.056909 | 0.056405 | 0.055506 | 0.066759 | 22.429283 | 0.053986 | 0.059091 | 0.056387 | 0.054664 | 0.058439 | 0.059300 |
[21]:
X_df2, y_df2 = g_featurized.transform(df2, ydf=None, kind='nodes')
reln_topic = pd.Series([ X_df2.columns[k] for k in X_df2.values.argmax(1) ])
df3 = df2.assign(reln_topic=reln_topic)
reln_topic.sample(10)
[21]:
392537     reln: kerberos, network, ntlm
3497381    reln: kerberos, network, ntlm
387017     reln: kerberos, network, ntlm
2356261    reln: kerberos, network, ntlm
1169846    reln: kerberos, network, ntlm
3038088    reln: kerberos, network, ntlm
2420173    reln: kerberos, network, ntlm
2441144          reln: batch, ntlm, wave
3933167    reln: kerberos, network, ntlm
2362703    reln: kerberos, network, ntlm
dtype: object
Comparison#
Any of these may be interesting as feature columns
[22]:
print({
    v: df3[v].nunique()
    for v in ['constant_edge_label', 'auth_type', 'logontype', 'reln', 'reln_topic']
})

df3[['constant_edge_label', 'auth_type', 'logontype', 'reln', 'reln_topic']].sample(10)
{'constant_edge_label': 1, 'auth_type': 17, 'logontype': 10, 'reln': 38, 'reln_topic': 15}
[22]:
| constant_edge_label | auth_type | logontype | reln | reln_topic | |
|---|---|---|---|---|---|
| 3181846 | 1 | ? | ? | ?::? | reln: batch, ntlm, wave |
| 3637183 | 1 | NTLM | Network | NTLM::Network | reln: kerberos, network, ntlm |
| 3527822 | 1 | Kerberos | Network | Kerberos::Network | reln: kerberos, network, ntlm |
| 2972171 | 1 | Kerberos | Network | Kerberos::Network | reln: kerberos, network, ntlm |
| 1844173 | 1 | ? | Network | ?::Network | reln: kerberos, network, ntlm |
| 3405729 | 1 | ? | Network | ?::Network | reln: kerberos, network, ntlm |
| 703185 | 1 | Kerberos | Network | Kerberos::Network | reln: kerberos, network, ntlm |
| 3827554 | 1 | ? | Network | ?::Network | reln: kerberos, network, ntlm |
| 2057222 | 1 | ? | Network | ?::Network | reln: kerberos, network, ntlm |
| 2072045 | 1 | Kerberos | Network | Kerberos::Network | reln: kerberos, network, ntlm |
Model training#
Graph: (computer)-[event]->(computer)
Edge relationship variants: untyped, auth_type, auth_type::logontype, topic model auth_type::logontype Node feature variants: none, sampled
Graph shape#
[23]:
# simple: graphistry.edges(df3, SRC, DST)

g = (
    graphistry
    .nodes(pd.concat([nodes, X], axis=1), NODE) ## adds computed node features
    .edges(df3, SRC, DST)
)
Node & edge data#
[24]:
print(g._nodes.shape)
g._nodes.sample(5)
(10904, 46)
[24]:
| computer | out_time_min | out_time_max | out_time_mean | out_dst_domain_mode | out_dst_domain_count | out_dst_computer_mode | out_dst_computer_count | out_auth_type_mode | out_auth_type_count | ... | reln: remoteinteractive, interactive, ntlm | reln: microsoft_authentication_package_v1, microsoft_authentication_package_v, microsoft_authentication_package_ | reln: kerberos, network, ntlm | reln: newcredentials, ntlm, wave | reln: microsoft_authentication_package_v1_0, microsoft_authentication_package_v1_, microsoft_authentication_package_v1 | reln: networkcleartext, ntlm, wave | reln: service, ntlm, wave | reln: unlock, wave, ntlm | reln: cachedinteractive, interactive, ntlm | reln: microsoft_authentica, microsoft_authentication_pa, microsoft_authentication_pac | |
|---|---|---|---|---|---|---|---|---|---|---|---|---|---|---|---|---|---|---|---|---|---|
| 554 | C1476 | 0.0 | 0.0 | 0.0 | 0.0 | 0.0 | 0.0 | ... | NaN | NaN | NaN | NaN | NaN | NaN | NaN | NaN | NaN | NaN | |||
| 8324 | C15964 | 0.0 | 0.0 | 0.0 | 0.0 | 0.0 | 0.0 | ... | NaN | NaN | NaN | NaN | NaN | NaN | NaN | NaN | NaN | NaN | |||
| 10540 | C5684 | 0.0 | 0.0 | 0.0 | 0.0 | 0.0 | 0.0 | ... | NaN | NaN | NaN | NaN | NaN | NaN | NaN | NaN | NaN | NaN | |||
| 1933 | C12857 | 0.0 | 0.0 | 0.0 | 0.0 | 0.0 | 0.0 | ... | NaN | NaN | NaN | NaN | NaN | NaN | NaN | NaN | NaN | NaN | |||
| 2428 | C14040 | 0.0 | 0.0 | 0.0 | 0.0 | 0.0 | 0.0 | ... | NaN | NaN | NaN | NaN | NaN | NaN | NaN | NaN | NaN | NaN |
5 rows × 46 columns
[25]:
print(g._edges.shape)
g._edges.sample(5)
(4000010, 13)
[25]:
| time | src_domain | dst_domain | src_computer | dst_computer | auth_type | logontype | authentication_orientation | success_or_failure | RED | constant_edge_label | reln | reln_topic | |
|---|---|---|---|---|---|---|---|---|---|---|---|---|---|
| 2919189 | 165394 | C1620$@DOM1 | C1620$@DOM1 | C1621 | C528 | ? | ? | TGS | Success | 0.0 | 1 | ?::? | reln: batch, ntlm, wave |
| 3926399 | 45204 | ANONYMOUS LOGON@C586 | ANONYMOUS LOGON@C586 | C2654 | C586 | NTLM | Network | LogOn | Success | 0.0 | 1 | NTLM::Network | reln: kerberos, network, ntlm |
| 390234 | 14983 | U6@DOM1 | U6@DOM1 | C61 | C61 | ? | Network | LogOff | Success | 0.0 | 1 | ?::Network | reln: kerberos, network, ntlm |
| 2017626 | 47099 | C1085$@DOM1 | C1085$@DOM1 | C467 | C467 | ? | Network | LogOff | Success | 0.0 | 1 | ?::Network | reln: kerberos, network, ntlm |
| 3126304 | 138945 | ANONYMOUS LOGON@C2106 | ANONYMOUS LOGON@C2106 | C8416 | C2106 | NTLM | Network | LogOn | Success | 0.0 | 1 | NTLM::Network | reln: kerberos, network, ntlm |
Train#
[26]:
# If GPU/CPU RAM low, try to free up
if True:
    g.reset_caches()
    torch.cuda.empty_cache()
Resumable – want to run for more epochs? Just run the cell again 🚀
[ ]:
is_gpu = True

# CPU + GPU both work!
# GPUs tested:
#   20-40M rows: 2 x GPUs (24 GB GPU RAM ea)
#   4M rows: 1 x 3080 Ti GPU  (12 GB GPU RAM)
# CPU: 32 GB RAM

dev0 = 'cpu'
if is_gpu:
    dev0 = 'cuda'

g2 = g.embed(

    #relation='constant_edge_label',
    #relation='auth_type',
    #relation='reln',
    #relation='reln_topic'

    #proto='RotatE',
    #proto='DistMult', ##default
    #proto='TransE',

    #if nodes: g.nodes(...), then g.embed(use_feats=True, X=['col1', ..], and optionally, y=['col10', ..]
    use_feat=True, #nodes with attributes
    X=[NODE] + good_feats,
    #cardinality_threshold=len(g._edges)+1, #avoid topic modeling on high-cardinality cols
    #min_words=len(g._edges)+1,  #avoid topic modeling on high-cardinality cols

    ##n_topics=21,

    train_split=0.99,
    batch_size=32,
    embedding_dim=32,
    evaluate=True,
    lr=0.004,  # 0.002, ..
    device=dev0,

    epochs=20,  # 20 if no features & 4M samples, 60+ if node features:
                # increase/rerun till score 85%+
)
Inspect model#
[27]:
g2._embed_model
[27]:
HeteroEmbed(
  (rgcn): RGCNEmbed(
    (emb): Embedding(10888, 32)
    (rgc1): RelGraphConv(
      (linear_r): TypedLinear(in_size=32, out_size=32, num_types=1, regularizer=bdd, num_bases=32)
      (dropout): Dropout(p=0.0, inplace=False)
    )
    (rgc2): RelGraphConv(
      (linear_r): TypedLinear(in_size=32, out_size=32, num_types=1)
      (dropout): Dropout(p=0.0, inplace=False)
    )
    (dropout): Dropout(p=0.2, inplace=False)
  )
)
[28]:
g2._embed_model.relational_embedding.shape
[28]:
torch.Size([1, 32])
[29]:
(
    g2._embed_model.relational_embedding.min(),
    g2._embed_model.relational_embedding.mean(),
    g2._embed_model.relational_embedding.max()
)
[29]:
(tensor(-0.4868, grad_fn=<MinBackward1>),
 tensor(0.0236, grad_fn=<MeanBackward0>),
 tensor(0.4513, grad_fn=<MaxBackward1>))
Explore hits#
[28]:
def to_cpu(tensor):
    """
    Helper for switching between is_gpu to avoid coercion errors
    """
    if is_gpu:
        return tensor.cpu()
    else:
        return tensor
[37]:
%%time
score2 = g2._score(g2._triplets)
df['score'] = to_cpu(score2).numpy()
type(score2), to_cpu(score2).numpy().min(), to_cpu(score2).numpy().max()
CPU times: user 998 ms, sys: 27.8 ms, total: 1.03 s
Wall time: 744 ms
[37]:
(torch.Tensor, 3.049316e-08, 0.99901354)
[38]:
anom_edges2 = df[to_cpu(score2).numpy() < 0.03]

print('number within threshold', anom_edges2.shape)

anom_edges2[
    anom_edges2['time'].isin(set(red_team[0])) &
    anom_edges2['src_computer'].isin(set(red_team[2])) &
    anom_edges2['dst_computer'].isin(set(red_team[3]))
].reset_index()
number within threshold (924, 11)
[38]:
| index | time | src_domain | dst_domain | src_computer | dst_computer | auth_type | logontype | authentication_orientation | success_or_failure | RED | score | |
|---|---|---|---|---|---|---|---|---|---|---|---|---|
| 0 | 4000000 | 151036 | U748@DOM1 | U748@DOM1 | C17693 | C305 | NTLM | Network | LogOn | Success | 1.0 | 0.006004 |
| 1 | 4000001 | 151648 | U748@DOM1 | U748@DOM1 | C17693 | C728 | NTLM | Network | LogOn | Success | 1.0 | 0.003731 |
| 2 | 4000003 | 153792 | U636@DOM1 | U636@DOM1 | C17693 | C294 | NTLM | Network | LogOn | Success | 1.0 | 0.020784 |
| 3 | 4000004 | 155219 | U748@DOM1 | U748@DOM1 | C17693 | C5693 | NTLM | Network | LogOn | Success | 1.0 | 0.023513 |
| 4 | 4000005 | 155399 | U748@DOM1 | U748@DOM1 | C17693 | C152 | NTLM | Network | LogOn | Success | 1.0 | 0.000488 |
| 5 | 4000007 | 155591 | U748@DOM1 | U748@DOM1 | C17693 | C332 | NTLM | Network | LogOn | Success | 1.0 | 0.006469 |
| 6 | 4000008 | 156658 | U748@DOM1 | U748@DOM1 | C17693 | C4280 | NTLM | Network | LogOn | Success | 1.0 | 0.005589 |
| 7 | 4000009 | 210086 | U748@DOM1 | U748@DOM1 | C18025 | C1493 | NTLM | Network | LogOn | Success | 1.0 | 0.009605 |
[31]:
srcindx = df.src_computer.isin(anom_label.src_computer)
dstindx = df.dst_computer.isin(anom_label.dst_computer)
srcscore = score2.cpu().numpy()[srcindx]
dstscore = score2.cpu().numpy()[dstindx]
[ ]:
sdf = df[srcindx | dstindx]
sdf
[33]:
# one can see from this graph that it is not entirely obvious that red team nodes are where they are, and certianly
gsmall = graphistry.edges(sdf, 'src_computer','dst_computer')
url = gsmall.plot(render=False)
url
[33]:
'https://hub.graphistry.com/graph/graph.html?dataset=3f5ec495b70449abad38834abafbccfc&type=arrow&viztoken=b274cd2e-e255-49bb-a5ce-34c6c9d54357&usertag=23693246-pygraphistry-0.28.4+78.g6f47e03&splashAfter=1669998005&info=true'
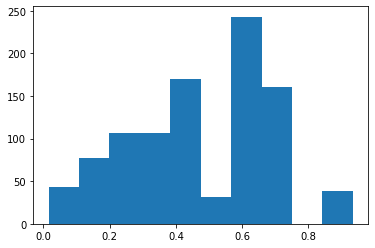
[35]:
import matplotlib.pyplot as plt
import numpy as np
s = np.r_[srcscore, dstscore]
plt.hist(s)
[35]:
(array([ 43.,  77., 107., 107., 170.,  31., 243., 160.,   0.,  39.]),
 array([0.01555263, 0.10742634, 0.19930004, 0.29117373, 0.38304743,
        0.47492114, 0.5667948 , 0.6586685 , 0.7505422 , 0.8424159 ,
        0.93428963], dtype=float32),
 <BarContainer object of 10 artists>)
Are simpler methods better?#
Maybe conditional probability p(dst_computer | src_computer) can give us good histograms to tease out red team nodes?
[53]:
def conditional_probability(x, given, df):
    """conditional probability function over categorical variables
       p(x|given) = p(x,given)/p(given)
    Args:
        x: the column variable of interest given the column 'given'
        given: the variabe to fix constant
        df: dataframe with columns [given, x]
    Returns:
        pd.DataFrame: the conditional probability of x given the column 'given'
    """
    return df.groupby([given])[x].apply(lambda g: g.value_counts()/len(g))
[54]:
auth.src_computer.nunique(), auth.dst_computer.nunique()
[54]:
(10475, 10313)
[55]:
pd.concat([auth.src_computer, auth.dst_computer]).nunique()
[55]:
10887
[56]:
cnp = conditional_probability('dst_computer', given='src_computer', df=auth)
cnp
[56]:
src_computer
C1            C1       0.438462
              C529     0.130769
              C625     0.092308
              C586     0.080769
              U25      0.076923
                         ...
C9997         C1065    0.010256
              C585     0.010256
              U7       0.005128
              C801     0.005128
              C2162    0.005128
Name: dst_computer, Length: 136119, dtype: float64
Conditional Graph#
[57]:
x=SRC
given=DST
condprobs = conditional_probability(x, given, df=auth)

cprob = pd.DataFrame(list(condprobs.index), columns=[given, x])
cprob['_probs'] = condprobs.values
[58]:
# now enrich the edges dataframe with the redteam data
indx = cprob.src_computer.isin(anom_label[SRC]) & cprob[DST].isin(anom_label[DST])
cprob.loc[indx, 'red'] = 1
cprob.loc[~indx, 'red'] = 0
[42]:
cg = graphistry.edges(cprob, x, given).bind(edge_weight='_probs')
cg.plot(render=False)
[42]:
'https://hub.graphistry.com/graph/graph.html?dataset=03bcc2f71a054a9c84fa5ce881f462bd&type=arrow&viztoken=abe69b16-c979-4ee5-b954-f6214d2d6b91&usertag=23693246-pygraphistry-refs/pull/408/head&splashAfter=1669918110&info=true'
Learning#
The conditional graph shows that most of the edge probabilities are between 4e-7 and 0.03, whose bucket contains 91k edges. Thus the chances of finding the red team edges are 10/91000 ~ 1e-4 – slim indeed
[43]:
# let's repeat but with reverse conditional
x='src_computer'
given='dst_computer'
condprobs2 = conditional_probability(x, given, df=auth)

cprob2 = pd.DataFrame(list(condprobs2.index), columns=[given, x])
cprob2['_probs'] = condprobs2.values
[44]:
# now enrich the edges dataframe with the redteam data
indx = cprob2.src_computer.isin(anom_label.src_computer) & cprob2.dst_computer.isin(anom_label.dst_computer)
cprob2.loc[indx, 'red'] = 1
cprob2.loc[~indx, 'red'] = 0
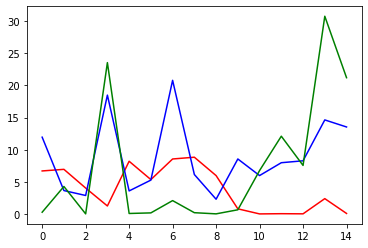
Can we do simple std analysis on red vs not?#
Not really
[56]:
red=X[:11].std(0).values
red
[56]:
array([6.69291932e+00, 6.94233955e+00, 4.03406261e+00, 1.24375581e+00,
       8.19816652e+00, 5.34599137e+00, 8.55273272e+00, 8.82849580e+00,
       5.97048788e+00, 7.98474697e-01, 7.14580528e-03, 4.22057963e-02,
       2.00462442e-02, 2.38532804e+00, 8.04956952e-02])
[57]:
import numpy as np
indx = np.random.choice(range(11, len(X)), 11)
rand = X.iloc[indx].std(0).values
rand
[57]:
array([2.72630555e-01, 4.27446082e+00, 1.50943836e-02, 2.35438425e+01,
       7.47794986e-02, 1.66500055e-01, 2.07862744e+00, 1.97366326e-01,
       1.64508509e-02, 6.49012753e-01, 6.75271878e+00, 1.20960431e+01,
       7.55023721e+00, 3.07596829e+01, 2.12004662e+01])
[58]:
blue=X[11:].std(0).values
blue
[58]:
array([11.94419565,  3.63960234,  2.87543166, 18.48754619,  3.58461871,
        5.26787065, 20.78975583,  6.13758242,  2.29442998,  8.55447084,
        5.97436329,  7.97298694,  8.26999525, 14.63120211, 13.53291024])
[61]:
from matplotlib import pyplot as plt


#plt.plot(red/blue)
plt.plot(red, c='r')
plt.plot(blue, c='b')
plt.plot(rand, c='g')
[61]:
[<matplotlib.lines.Line2D at 0x7f954901ef70>]
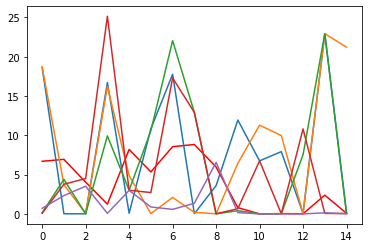
[62]:
plt.plot(red, c='r')
rands = []
for k in range(4):
    indx = np.random.choice(range(11, len(X)), 11)
    rand = X.iloc[indx].std(0).values
    plt.plot(rand)
    rands.append(rand)

plt.plot(red/np.mean(rands, axis=0))
[62]:
[<matplotlib.lines.Line2D at 0x7f953806d0d0>]
Resource#
-
Dashboarding with graph-app-kit (containerized, gpu, graph Streamlit)
GNN Videos:
Euler (combining RNN + GNN)- https://www.youtube.com/watch?v=1t124vguwJ8
[ ]: